


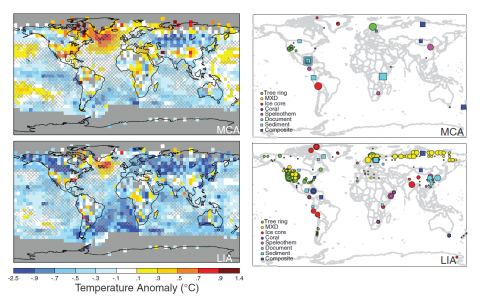
Reconstructed surface temperature pattern for MCA (950 to 1250 C.E.) and LIA (1400 to 1700 C.E.). Shown are the mean surface temperature anomaly (left) and associated relative weightings of various proxy records used (indicated by size of symbols) for the low-frequency component of the reconstruction (right). Anomalies are defined relative to the 1961 1990 reference period mean. Statistical skill is indicated by hatching [regions that pass validation tests at the P = 0.05 level with respect to RE (CE) are denoted by / (\) hatching]. Gray mask indicates regions for which inadequate long-termmodern observational surface temperature data are available for the purposes of calibration and validation.