


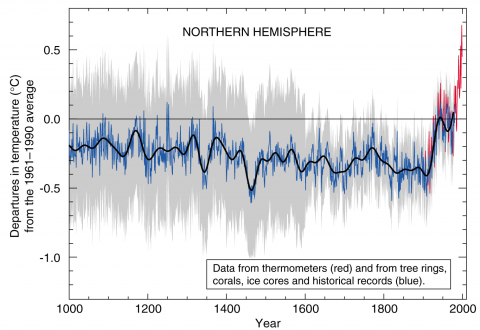
Time reconstructions [blue] and instrumental data [red] for Northern Hemisphere mean temperature (NH). In both cases, the zero line corresponds to the 1902-80 calibration mean of the quantity. Raw data are shown up to 1995 and positive and negative 2-sigma uncertainty limits are shown by the grey shaded region. The thick black line corresponds to a lowpass filtered version of the reconstruction.