


Two decades ago, in an interview with science journalist Richard Kerr for the journal Science, I coined the term the "Atlantic Multidecadal Oscillation" (the "AMO" for short) to describe an internal oscillation in the climate system resulting from interactions between North Atlantic ocean currents and wind patterns. These interactions were thought to lead to alternating decades-long intervals of warming and cooling centered in the extratropical North Atlantic that play out on 40-60 year timescales (hence the name). Think of the purported AMO as a much slower relative of the El Nino/Southern Oscillation (ENSO), with a longer timescale of oscillation (multidecadal rather than interannual) and centered in a different region (the North Atlantic rather than the tropical Pacific).
Today, in a research article published in the same journal Science, my colleagues and I have provided what we consider to be the most definitive evidence yet that the AMO doesn't actually exist.
Background:
Back in the 1980s and 1990s, a number of articles pointed to a pattern of North Atlantic warming during the 1930s-1950s, subsequent cooling in the 1960s and 1970s, and warming thereafter, which seemed to resemble a natural oscillation in the climate system. I co-authored an article in the journal Nature demonstrating the apparent persistence of these multidecadal oscillations several centuries back in time based on the analysis of paleoclimate proxy data (our analysis of similar proxy data would ultimately lead, a few years later, to the now well-found "hockey stick" curve that shows the warming of the past century to be anomalous in a long-term context).
In 2000, in an article that led to Kerr's commentary in Science, my collaborator from the climate modeling group at the Princeton Geophysical Fluid Dynamics Laboratory (GFDL) Tom Delworth and I argued that this observational evidence for an AMO-like climate oscillation was supported by an analysis of an extended (thousand+ year long) control simulation of GFDL's state-of-the-art (at the time) coupld ocean-atmosphere model. Since it was a control simulation with no external "forcing" (no greenhouse gas changes, no variations in solar output, no volcanic eruptions, etc.), any oscillation that was produced has to be internally generated. And indeed we established that this model did produce an internal such oscillation, with a multidecadal timescale, centered in the extratropical North Atlantic, tied to coupled ocean-atmosphere processes involving the ocean "conveyor belt" circulation (sometimes called the thermohaline circulation and sometimes equated with the "Gulf Stream", though the latter in fact is a wind-driven current in mid-latitudes, while the thermohaline circulation/conveyor belt represents its extension on into the higher latitudes of the North Atlantic). About five years later, analysis of an extended simulation of yet another climate model--the coupled ocean-atmosphere model run by the Hadley Centre within the UK Meteorological Office, yielded evidence for a similar oscillation, albeit with a longer (roughly 100 year) period, and a more global signature.
As I've stated elsewhere, at times I feel like I created a monster when I gave a name to this putative climate oscillation in 2000. The concept of the AMO has since been misapplied and misrepresented to explain away just about every climate trend under the sun, often based on flawed statistical methods that don't properly distinguish a true climate oscillation from a time-varying trend: If you assume that all trends are a simple linear ramp, and call everything left-over an "oscillation", then the simple fact that global warming flattened out from the 1950s through the 1970s driven by the ramp-up in cooling sulphate aerosol pollution masquerades as an apparent "oscillation" on top of a simple linear trend. We've published a number of articles over the years (see e.g. here, here, here, here, here, and here) demonstrating that studies that use such an approach to define the "AMO" end up misattributing to a natural "oscillation" what is actually human-caused climate change. Such analyses have been used by some to dismiss, among other things, the impact climate change is having on increasingly active and destructive Atlantic hurricane seasons, attributing the increase in recent decades to a supposed upturn in the "AMO".
But if the "AMO" is simply an artifact of studies that misinterpret the time-varying pattern of human-caused climate change as a low-frequency oscillation, what about the studies mentioed previously that identify an internal oscillation in control simulations of climate models? It turns out that they are the exception (indeed the rare exception), rather than the rule. Decades ago there were only a handful of long control coupled model simulations and two in particular (the GFDL and UK Met Office coupled models, as noted earlier) did generate an AMO-like oscillation (though the spatial patterns, timescales, and apparent mechanisms in the two cases were different enough that one could question whether they truly represented the same thing).
Today, by contrast, there are many dozens of coupled models around the world, and the Coupled Model Intercomparison Project ("CMIP") makes the ensembles of simulations widely available to other researchers in what are known as "multimodel" archives. So what does an analysis of these multimodel ensembles reveal?
Analysis of Historical and Control Simulations:
In an article we published in the journal Nature Communications a year ago, we showed that the AMO does not in general exist in current generation models. We analyzed a set of long control simulations with more than 40 different state-of-the-art climate model simulations from the "CMIP5" multimodel climate archive used in the most recent (5th) assessment report of the Intergovernmental Panel on Climate Change (or "IPCC"). We used a type of "spectral analysis"--that is to say, a statistical procedure that identifies whether there is evidence for truly oscillatory variability (in the form of a spectral "peak", i.e. a spike in the plot of amplitude of variation as a function of frequency/period) at some particular timescale or narrow range of timescales. The method, known as "MTM-SVD", identifies whether an entite spatiotemporal dataset contains an oscillatory signal (as indicated by a spectral peak that is correlated across the dataset, in this case, surface temperatures spanning the globe) that is distinct from simple background noise (i.e. random variability).
As shown below (Figure 1--left), the CMIP5 control runs show strong evidence of oscillatory behavior on 3-7 year interannual timescales associated with ENSO. The vast majority of simulations exhibit a statistically-signficant spectral peak within that range of periods, and even the average across all simulations crosses the 90% ("p=0.1") significance threshold, despite the tendency for cancelation when averaging (since different models yield significant ENSO-timescale peaks at different periodicities within the 3-7 year range). By contrast, the models show no evidence for a spectral peak on the 40-60 year "AMO" timescale (see the inset which zooms in on decadal and longer timescales). The behavior on that timescale is largely consistent with what one would expect from random data.
Yet, actual historical surface temperature data from 1850-present (see thick blue curve), in addition to showing significant interannual ENSO-timescale peaks, do indeed yield a spectral peak centered at a multidecadal 40-50 year period. Do the results for the historical data, then, contradict what we find with the model simulations? As it turns out, no.
Consider a parallel analysis (Figure 1-right) of the CMIP5 historical simulations. These are simulations that have been driven with the same external factors (the human factors of rising greenhouse gas concentrations and sulphate aerosols, and natural factors such as solar output changes and volcanic eruptions) that have driven temperature changes over the historical period of 1850-present. In this case, the models reproduce the 40-50 year multidecadal spectral peak seen in the actual observations. Indeed, the peak is seen in nearly every simulation and is significant at the 99% ("p=0.01") level even for the average over all simulations. Clearly the multidecadal spectral peak is a very robust feature of both the historical simulations and the historical observations themselves. But it's not indicative of an AMO.
An analysis of the simulations shows that the multidecadal peak is tied to the same pattern of 1930s-1950s warming, 1960s and 1970s, cooling and warming thereafter that is seen in the actual observations as discussed earlier. That alone raises suspicions, since if this were an internally-generated oscillation, there is no reason that the warming and cooling phases in the models would coincide in timing with those in the observations. Instead, as discussed earlier, the alternating warming and cooling is tied to the competition between steady greenhouse warming and the prominent sulphate aerosol cooling of the 1950s-1970s. The aerosol cooling is especially pronounced in the North Atlantic (particularly during summer) as noted by Mann and Emanuel (2005) helping to explain why the apparent "oscillation" is most pronounced in that region.
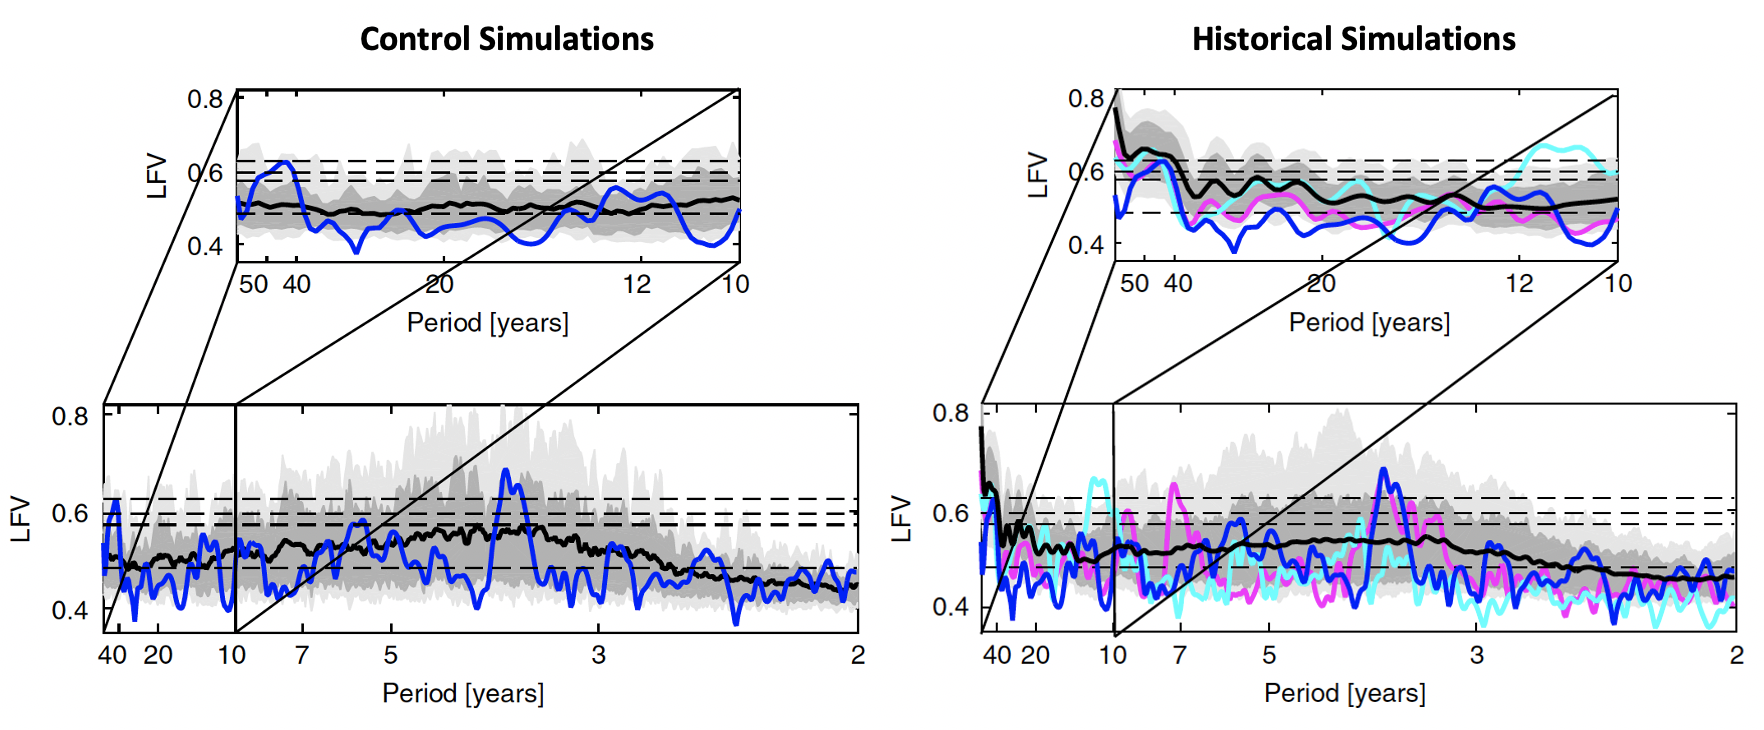
Figure 1. Spectra from MTM-SVD analysis of global surface temperature fields from CMIP5 control simulations (left) and historical simulations (right). Shading with mean over all model simulations is shown by black curve and historical result is shown by blue curve. Dark grey region bounds 68% of the simulations while light grey region bounds 95% of the simulations. Inset zooms in on the decadal (f=0.1 cycle/year) and longer periodicities. Horizontal dashed lines correspond to median (p=0.5) and p=0.1, 0.05 and 0.01 significance levels relative to coloured noise null hypothesis.
At this point prospects for the existence of an internal AMO climate oscillation might be starting to look rather bleak. But there is still one seemingly compelling argument left for AMO advocates: If the AMO is indeed an artifact of competing anthropogenic greenhouse gas and sulphate aerosol forcing during the historical era, then why is it that AMO signals, as noted earlier, have been detected in paleoclimate proxy data that pre-date the historical period?
In fact, a recent critique of our aforementioned analysis of the CMIP5 control and historical simulations published in the somewhat controversial journal Frontiers rests on that very argument. Is there merit to this argument?
Analysis of Last Millennium Simulations:
In our new Science article, my co-authors (Byron Steinman, Daniel Brouillette, Sonya Miller) and I analyzed the CMIP5 "last millennium" simulations (16 in total) that span the interval 850-1849 CE. These simulations precede the historical period and are driven by natural (primarily volcanic and solar) radiative forcing alone. Application of the same (MTM-SVD) analysis as above to the model surface temperature fields yields evidence for a multidecadal (~60 year period) AMO-like spectral peak in the majority of simulations (12 out of 16 at the 90% significance level and 11 out of 16 at the 99% significance level). The results are shown in Figure 2 where they are compared against the previously discussed "control simulation" results. The difference is striking. In the control simulations, where no forcing is applied, there is no evidence (as we've already seen) for a distinct multidecadal spectral peak. Yet there is robust evidence for just such a peak in the "last millennium" simulations, where natural (volcanic and solar) radiative forcing has been applied. This comparison suggests that the natural radiative forcing must be responsible for the apparent AMO-like signal.
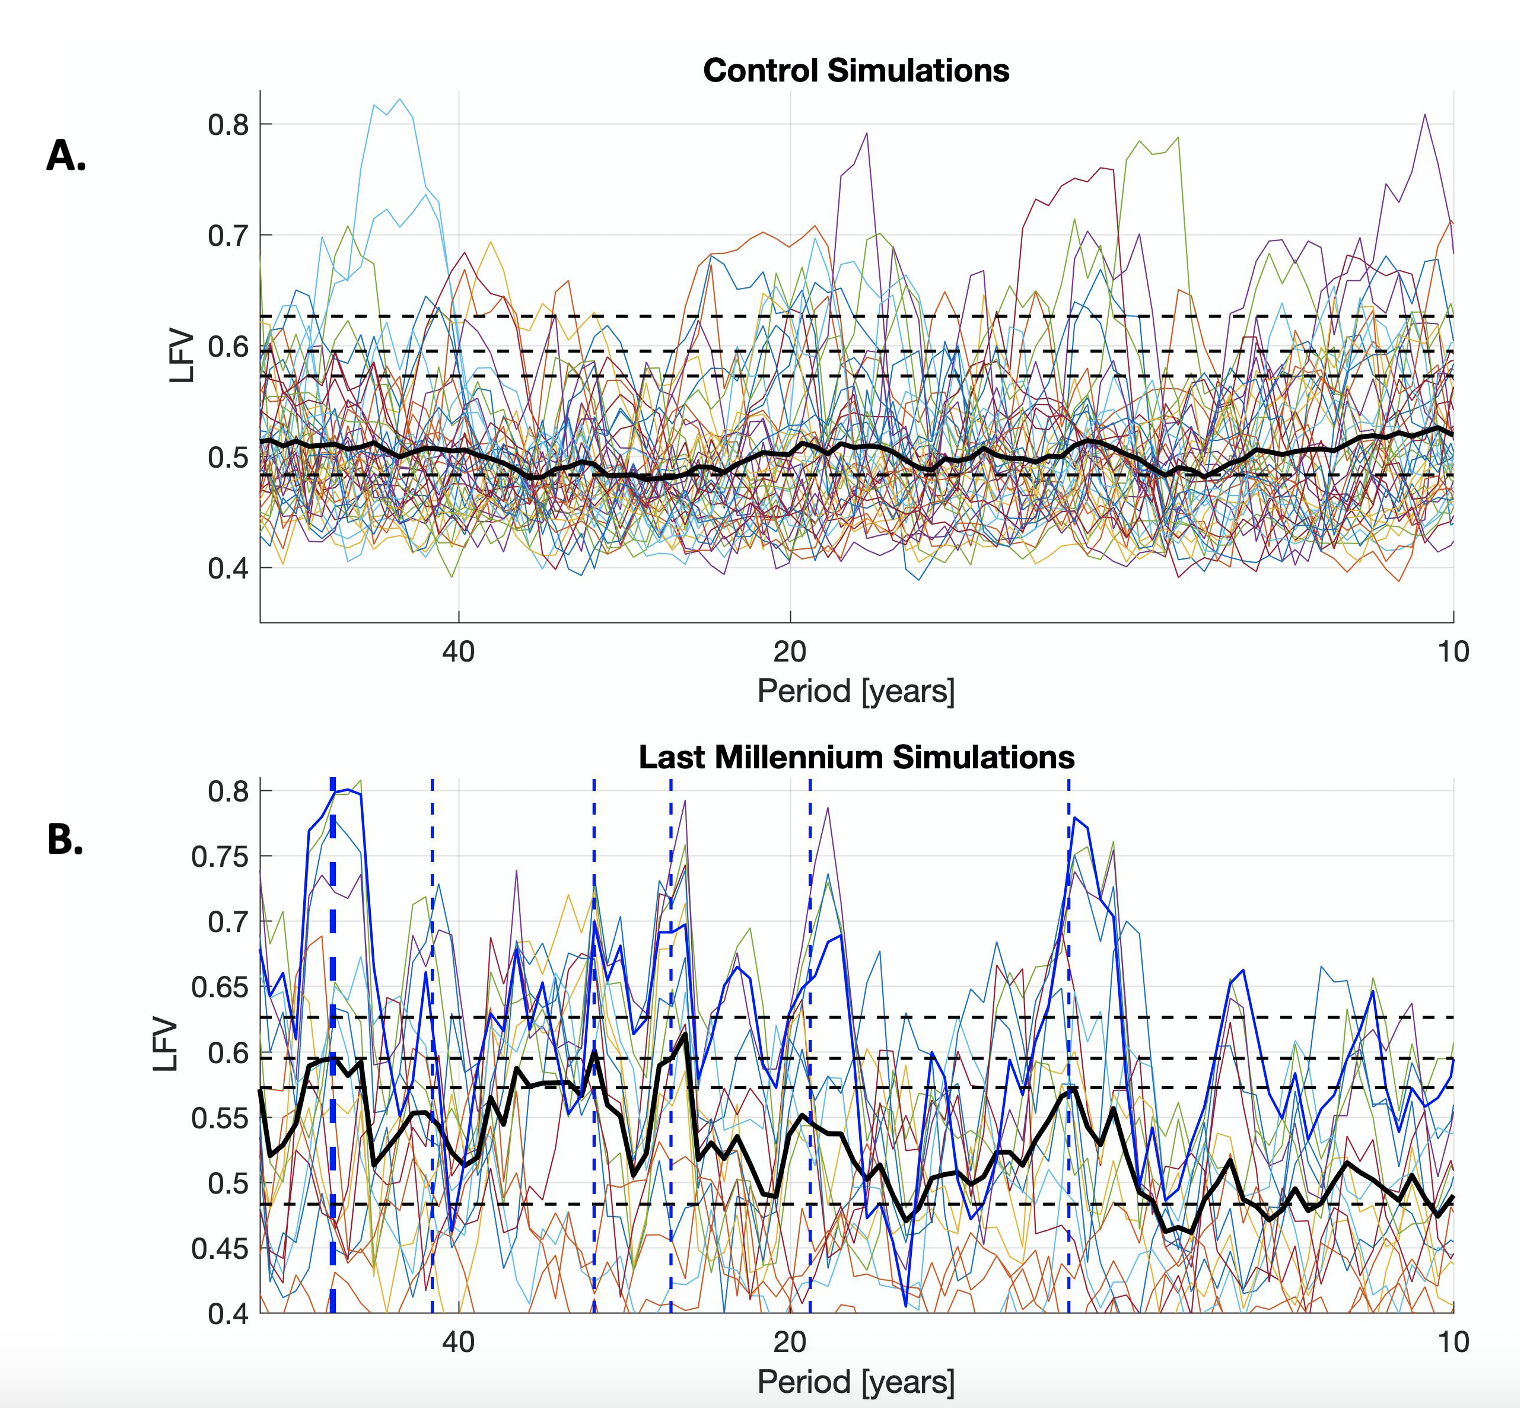
Figure 2. Spectra from MTM-SVD analysis of global surface temperature fields . A. CMIP5 control simulations. Individual colored curves depict results for all N=44 simulations while the ensemble mean is shown by the thick black curve. Horizontal dashed lines correspond to median (p=0.5) and p=0.1, 0.05 and 0.01 significance levels relative to colored noise null hypothesis. B. Same as A. but for the N=16 CMIP5 Last Millennium simulations (the more prominent blue curve denotes the GISS-E2-R simulation examined in Figure 3) below.
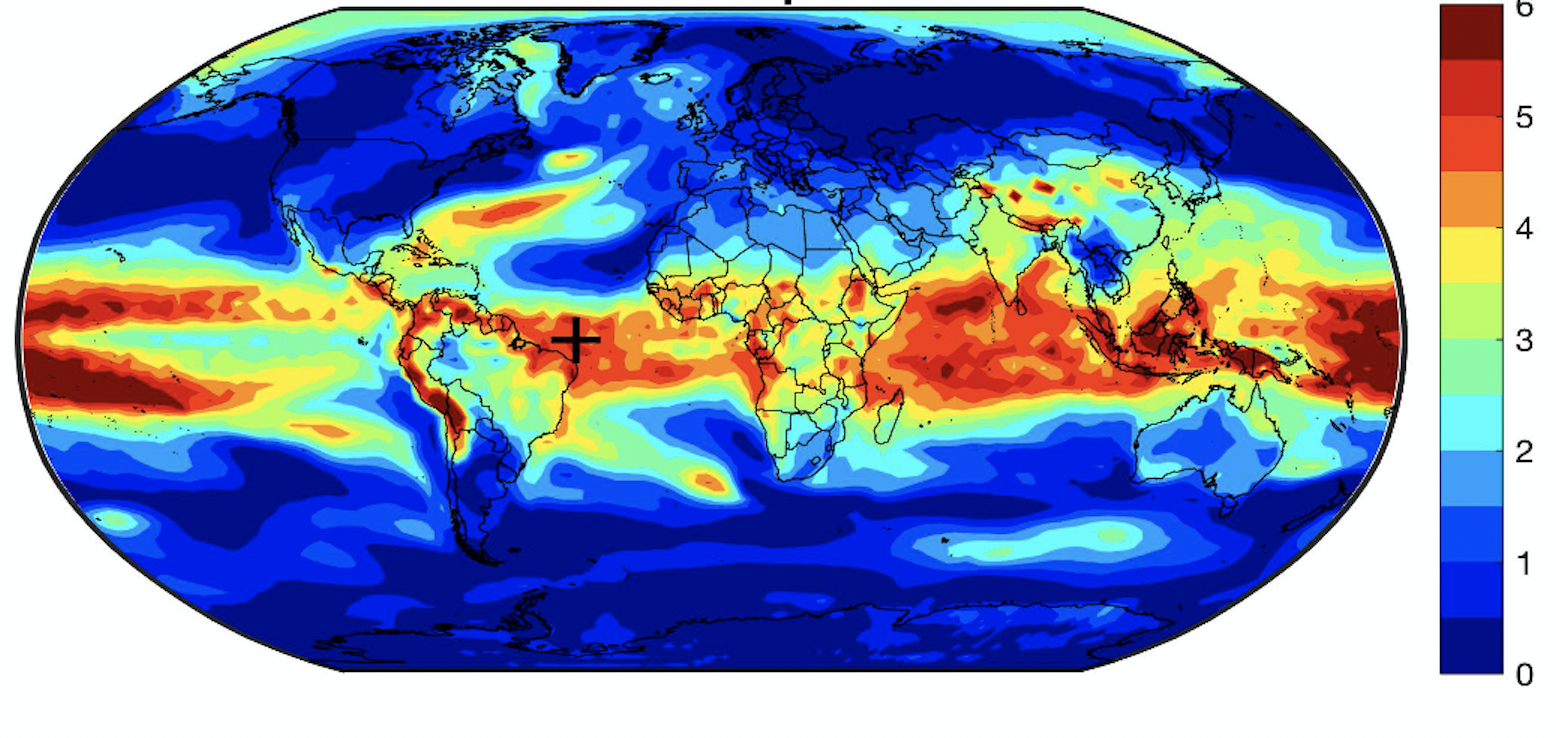
One convenient feature about the MTM-SVD method is that it allows you to reconstruct the spatial and temporal pattern of the signal associated with a particular spectral peak. We take, for example, the individual simulation (a simulation of the NASA GISS-E2-R model) that produced the most prominent ~60 year spectral peak in Figure 2B. The spatial and temporal pattern of the corresponding signal is readily reconstructed and shown in Figure 3 below.
There are a number of revealing features in the signal pattern. The spatial pattern (Figure 3A) displays a high-amplitude response in the tropical regions that is reminiscent of the pattern of response to explosive tropical volcanism (temperatures cool the most in the tropics after an explosive tropical eruption since the more sunlight you have in the first place, the more that is reduced by a volcanic dust veil). It is notable that there is also some evidence of enhanced signal amplitude along the Gulf stream extension in the North Atlantic, suggestion some possible coupling to North Atlantic ocean dynamics. A detailed analysis of the evolving spatial pattern of the signal over a typical ~60 year cycle (see article) shows a close correspondence between the intial phase (coinciding with peak global cooling) and the pattern of response to explosive tropical eruption established in some past studies.
The temporal pattern (Figure 3BC) shows that the major cooling excursions coincide with several of the largest explosive tropical eruptions of the last millennium (e.g. the 1258 CE, 1331CE, and 1453 CE eruptions), which happen to be paced in a manner that projects onto an apparent multidecadal (60-70 year period) "oscillation". Past studies have indeed noted the coincident multidecadal pacing of explosive volcanic activity in past centuries.
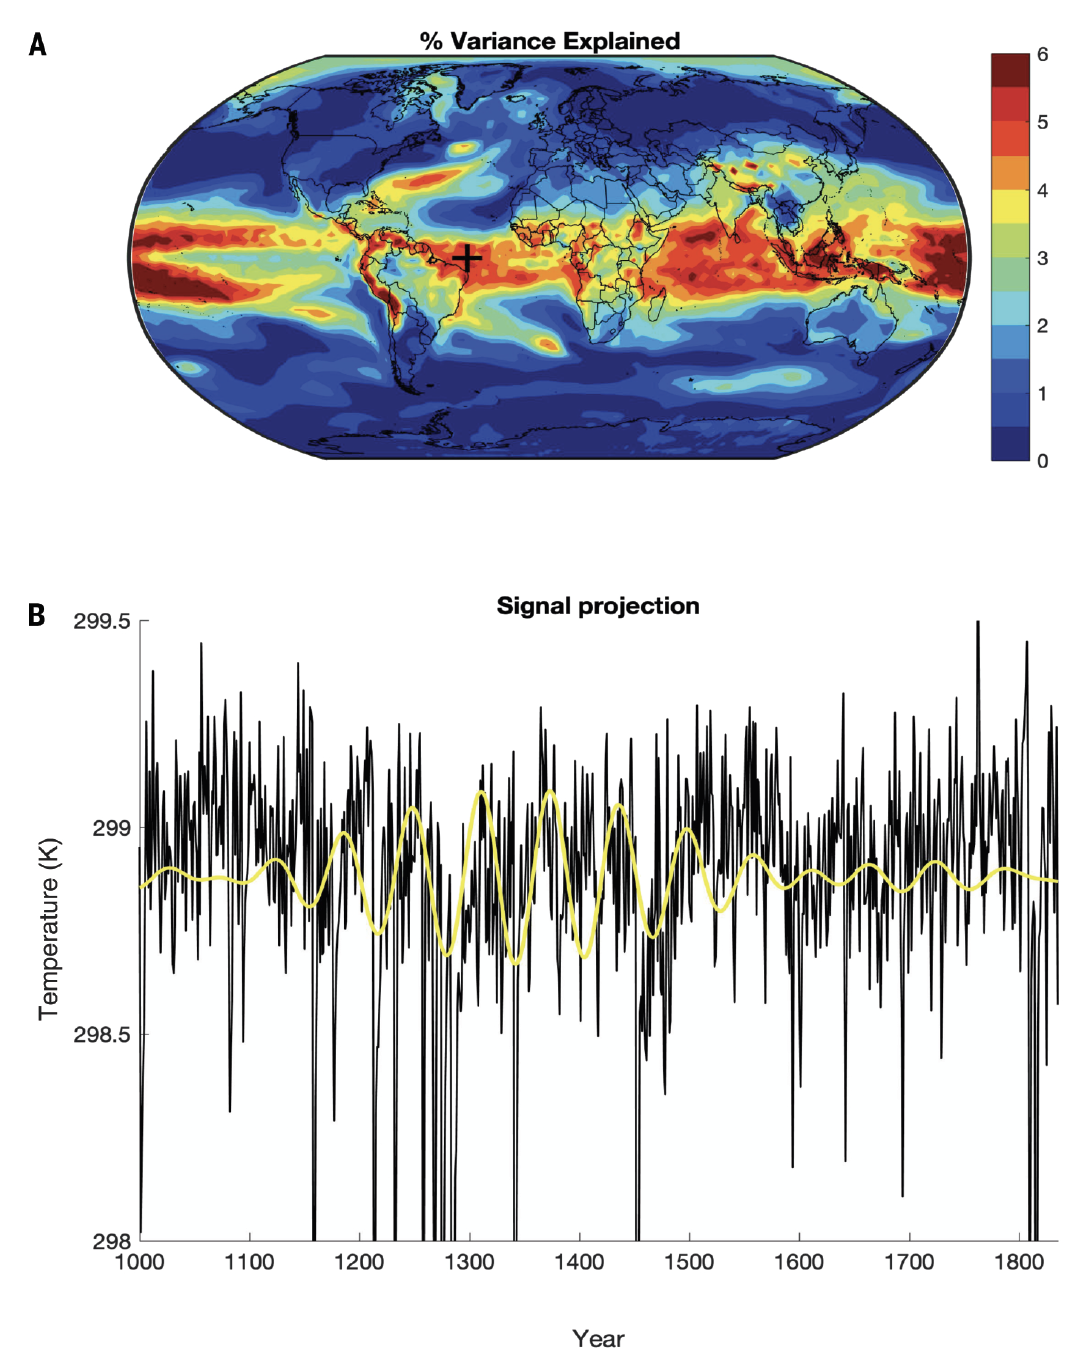
Figure 3. Spatial and temporal characteristics of multidecadal “signal” (centered at f=0.016 cycle/year/ ~63 year period) for CMIP5 GISS E2-R Last Millennium simulation. A. spatial pattern of % resolved variance associated with signal and B. reconstructed time-domain signal for representative equatorial eastern Atlantic grid box (grid box centered on longitude 35W and latitude 0; location denoted by the large black ‘+’ in panel ‘A').
A spectral analysis of a simple "energy balance" climate model driven with volcanic-only, solar-only, and volcanic+solar forcing (see article) shows that there is indeed a multidecadal spectral peak in the response of surface temperatures to natural radiative forcing AND that peak arises from the volcanic forcing alone. We conclude that the apparent AMO-like signal during the pre-historic era is a consequence of the coincidental multidecadal pacing by episodes of explosive volcanic forcing.
The available evidence both from observations and current-generation climate models, in summary, does not provide any support for an internal AMO-like oscillation in the climate system.
That doesn't mean that there aren't interesting questions left to address here. Our planned future work will examine the next generation (CMIP6) coupled models to see if improved representations of ocean and atmospheric dynamics might somehow lead to modes of internal decadal/multidecadal variability that are not evident in the CMIP5 models. And it will be instructive to analyze the considerably more extensive networks of paleoclimate proxy data that have become available since our Nature (1995) analysis. Of particular interest is whether the multidecadal oscillations in the actual paleoclimate proxy data show the same relationship with volcanic forcing demonstrated in the last millennium simulations.
Concluding Thoughts:
There are several lessons in this tale. One is that scientists must always be open to revising past thinking. That is part of the critical scientific process---what the great Carl Sagan referred to as the "self-correcting machinery" of science. Two decades ago there seemed to be both observational evidence and modeling evidence (if rather limited) for the existence of a multidecadal AMO oscillation in the climate system. My own work supported that interpretation, and indeed it was I who gave this beast a name: the "Atlantic Multidecadal Oscillation" or simply "AMO. The scientific community ran with the concept, and some scientists---even some at our leading research laboratories like the aforementioned GFDL—continued to misapply it in a way that downplays some critical climate change impacts like the warming of the North Atlantic and the increase in Atlantic hurricane activity associated with it.
Now we have come full circle. My collaborators and I, over the past decade, have continued to investigate the origins of the putative AMO signal and have been led inescapably to the conclusion that the AMO (unlike, say, the R.O.U.S.) doesn't actually exist. It's an artifact, during the historical era, of competing anthropogenic (greenhouse warming and sulphate aerosol cooling) drivers and, during the pre-historic era, an artifact of the fact that volcanic forcing happens to have displayed a roughly multidecadal pacing in past centuries.
A scientist has to admit when they are wrong. Unfortunately for all of us, my colleagues and I weren't wrong about the unprecedented warming betrayed by the now iconic "Hockey Stick" curve, despite the unrelenting attacks on it by climate change deniers over the past two decades.
But I WAS wrong about the existence an internal AMO oscillation when I coined the term twenty years ago.
Nonetheless, some very good science has been done by a number of researchers and groups around the world in pursuing this matter. And we have learned quite a bit, for example, about the true origins of multidecadal climate variability, and prospects for long-term climate prediction.
That, in fact, is science (and Science) working the way it's supposed to.
_____________
Follow Michael E. Mann on Twitter or Facebook to be notified of new blog posts, or subscribe by RSS.

This work is licensed under a Creative Commons Attribution 4.0 International License.