

We have a new study out in the latest issue of the Proceeding of the National Academy of Sciences examining trends in the characteristics of highly impactful U.S. east coast winter storms known as nor’easters (for the unusual northeasterly–that’s, from the northeast–winds associated with these storms). Here is the plain language summary of our findings:
Nor’easters, with their heavy precipitation and strong winds, pose significant threats to cities along the U.S. East Coast, often leading to devastating impacts. Some of the most notable nor’easters include the “Perfect Storm,” “Storm of the Century,” “Snowmaggedon,” and the January 2018 blizzard. Using a cyclone tracking approach combined with long-term reanalysis data, we present a comprehensive and homogeneous historical record of Atlantic nor’easters. Our analysis of nor’easter characteristics reveals that the strongest nor’easters are becoming stronger, with both the maximum wind speeds of the most intense (>66th percentile) nor’easters and hourly precipitation rates increasing since 1940, suggesting an additional contribution to coastal risk in a warming world.
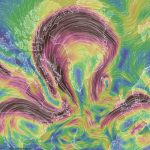
We set out, with this study, to create a virtual atlas of nor’easters, analyzing atmospheric reanalysis data spanning nearly the past century. We considered storms that fell within the conventional nor’easter storm season (September-April) that (a) intersected with the U.S. East Coast at least once, (b) traveled a minimum distance of 1,000 kilometers (about 620 miles), (c) lasted for at least 24 hours, and (d) reached a minimum sea-level pressure of 980 millibars (or “hectopascals”). Applying these criteria, application of our tracking algorithm to hourly reanalysis data back to 1940 identified a total of 900 total nor’easters (average of ~11 per year) between 1940 and 2025. (see Figure below).

We then analyzed the dataset for trends over time, focusing on two key storm characteristics–intensity, as measured by peak sustained winds, and mean hourly precipitation. We found that there is a very small, statistically insignificant increase in average intensity of storms over time. Using the statistical technique known as quantile regression, however, we found that the trend in intensity increases in magnitude and significance for increasingly higher percentiles of storm intensity (see Figure below). For the 99% percentile, we see an increase over the 85 year period from peak wind speeds of ~31 m/s (69 mph) to ~33m/s (74 mph), a roughly 6% increase. That might seem a modest increase, but power dissipation by a storm varies as the wind speed cubed, so that increase in peak wind speeds corresponds to a sizeable, roughly 20% increase in destructive potential.

In other words, we found that the strongest storms are getting stronger, and more damaging. A similar conclusion has been reached in previous work examining the intensification of tropical storms over time. The mechanisms behind the development and strengthening of extratropical storms (of which nor’easters are a subclass), however, are different from those governing hurricanes. Arctic amplification of warming, which is a key feature of human-caused climate change, is in fact likely to lead to weaker extratropical storms overall, since these storms feed on what’s known as baroclinic instability, associated with the clashing of warm subtropical and cold subpolar air masses, which we expect less of in a warming world. But unlike most extratropical storms–and instead, like tropical storms–nor’easters also feed off the relative warmth of the oceans (through the latent heat of evaporation of seawater), which is increasing due to human-caused warming . So those nor’easters that do develop have the potential to grow stronger than they otherwise would have in the presence of unusually warm ocean waters. And our study demonstrates that this can now be seen in the observations.
Why do we care so much about the strongest nor’easters? They’re the ones that by far do the most damage.They can lead to catastrophic coastal erosion, destruction of buildings and infrastructure, and paralyzing snowfalls. While the 1991 “Perfect Storm” may be the most famous of nor’easters, thank to the book and film of the same name that have immortalized this storm, it was hardly the most damaging. That instead was the 1962 “Ash Wednesday storm“—with its 84 mph gusts. In today’s dollars, it did 31 billion dollars worth of damage, rivaling the damage from a major landfalling hurricane. Given the significant increase in coastal development in historically impacted areas, such estimates likely under-represents the true potential economic consequences of comparable events today.
Indeed, my own interest in these storms, and how they’re being impacted by climate change, has been inspired by several personal experiences. First, there’s the March 1993 “Storm of the Century”. I was on vacation with friends in Florida when the storm exploded along the southeast coast of the U.S. On the way back we stopped off at St Augustine. Temperatures dropped from the 70s to the 40s Fahrenheit in a matter of hours. We drove past Okefenokee Swamp later that day and it was snowing. We stopped off in southern Georgia for the night and temperatures dropped down into the frigid mid 20s.
Then there’s the Feb ’10 “Snowmaggedon” when climate-denying former Senator James Inhofe (R-OK) infamously built his Igloo on capital hill to mock Al Gore and global warming. I had been invited to Penn to give a talk in the physics department on “the physics of climate change” (I was a Penn State faculty member at the time). Instead, I ended up stuck in my hotel room for 3 days with Penn closed down and the interstates impassable with more than 2 feet of snow on the ground. I was never able to give my talk. But now 15 years later, I’m a faculty member at Penn, doing research into that very storm (there’s a nice piece in Penn’s Omnia magazine about this particular backstory).
Finally, there is the January 2018 “blizzard” storm, a “bomb cyclone” that exploded over still warm ocean waters off the southeastern U.S. coast, reaching an astonishing minimum pressure of 949 millibars, which is equivalent to a category 3 or 4 hurricane. I was on a skiing vacation with family in the Pocono Mountains of eastern Pennsylvania as the storm’s center passed us to the east off the mid-Atlantic coast. Temperatures reached a bitter -10F the night we arrived, with daytime highs hovering around 0F (and wind chills much lower than that), thanks to the powerful northerly winds ushering in frigid Arctic air along the western flank of the storm (I wrote about it here at the time).
It may seem counterintuitive that we might see more of these sorts of cold extremes of this sort as the planet continues to warm, and there is less frigid air up in the Arctic. However, the cold air that does remain up north is more likely to find its way south on the backside of these storms along the U.S. east coast.
We can expect even more intense intense nor’easters in a warmer world. As we state at the end of the article:
The potential for greater likelihood of future super-nor’easters, akin to the 1993 Storm of the Century and Feb 2010 Snowmaggedon, driven by a combination of intense convection, explosive cyclogenesis, portends prospects of paralyzing snowfalls, dangerous storm surges, and episodic cold extremes, underscoring the urgent need for coordinated efforts to assess and mitigate the devastating impacts of future such storms.
Rapid decarbonization can bring a halt to surface warming, including the rising sea surface temperatures feeding these dangerous and damagin storms. So in the end, it still comes down to the policy choices we make. The laws of physics are immutable, but human behavior is not.
